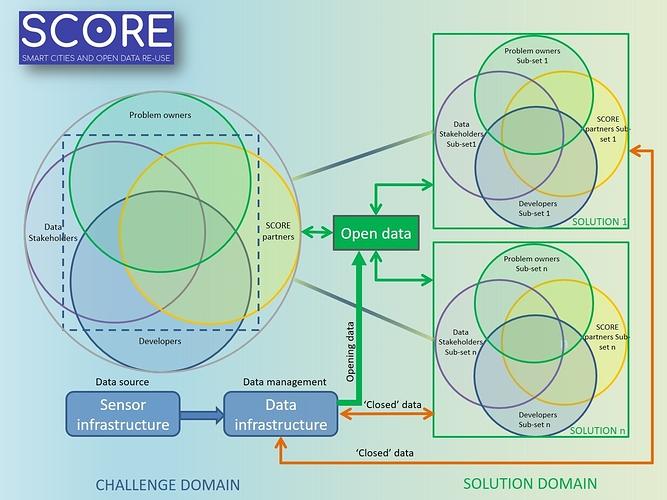
The team at Bradford Council have been working on a conceptual diagram
(see below  )
)
for the SCORE project which might be used to show areas of participation and stakeholder engagement in Challenge groups and how these can generate Solutions.
I’m sure it can be improved but hopefully it will promote a useful discussion at the Aarhus meeting that can help define what SCORE is doing well, and what we might need to improve.
On the left is the ‘Challenge Domain’ showing the key roles that are needed to build the ‘Solutions’. By having representation in all these areas the Challenge Domain is well equipped to propagate ideas for multiple Solutions.
The active participants in the Challenge are located within the dashed box. Other stakeholders who may have an interest but are not engaged can be placed outside the dashed box.
On the right is the ‘Solution Domain’.
Each Challenge may generate several Solutions, the participants of these are sub-sets of the Challenge participants.
The open data /data infrastructure depiction is idealised and not intended to be definitive.
This diagram can be populated in several ways:
• By organisation e.g. Bradford Council, Digipolis, City of Aarhus, Environment Agency etc.
• By type of organisation e.g. municipality, academic/research institution, Government body, community group etc.
• By individual e.g @sydsimpson , @timvanachte , @h.niesing etc.
The diagram can be used for specific Challenge / Solution examples or as an aggregate of all Challenges / Solutions to highlight activity and engagement by all partners. Again the roles of the participants can be represented several times, fulfilling varied roles both in Challenges and Solutions.
I hope you find this of interest, certainly I have found it useful in understanding the make up of the Water Challenge and associated Solutions.


